Data Visualization Techniques
Welcome to our comprehensive guide on data visualization techniques! This resource is designed specifically for students studying computer science, focusing on data science and big data. Whether you're just starting your journey or nearing graduation, this documentation aims to provide valuable insights and practical knowledge to enhance your understanding of data visualization.
Introduction
Data visualization is a crucial skill in the field of data science and big data analysis. It allows us to communicate complex information effectively, identify patterns, and gain actionable insights from large datasets. As a student in this field, mastering data visualization techniques will significantly improve your ability to present findings, tell stories with data, and make informed decisions based on visual representations of data.
In this documentation, we'll explore various data visualization techniques, discuss their applications, and provide practical examples to help you understand each method better. We'll cover both traditional and modern approaches, ensuring that you have a well-rounded understanding of the tools available in this rapidly evolving field.
Table of Contents
- Introduction to Data Visualization
- Types of Data Visualization
- Popular Data Visualization Tools
- Best Practices for Data Visualization
- Case Studies and Examples
Introduction to Data Visualization
Data visualization is the process of creating images, charts, graphs, and other visual representations of data. It involves transforming raw data into a form that is easier to understand and interpret visually. This technique has become increasingly important in fields such as business intelligence, scientific research, and public policy-making.
Why Use Data Visualization?
-
Improved Understanding: Visualizing data helps in grasping complex relationships and trends more easily than reading through tables or reports.
-
Faster Decision Making: By presenting information in a clear, concise manner, data visualization enables quicker decision-making processes.
-
Identifying Patterns: It aids in identifying hidden patterns and correlations within large datasets.
-
Communication Effectiveness: Data visualization makes it easier to convey information to non-technical audiences.
-
Time-Saving: Instead of manually analyzing data, visualization tools can quickly highlight key points and trends.
Types of Data Visualization
Data visualization encompasses several types of representations, each suited for specific purposes and data types.
Statistical Graphics
Statistical graphics are used to visualize statistical data and relationships. They often involve plotting data points on coordinate systems.
Examples:
-
Scatter Plots: Useful for showing the relationship between two variables. Each point represents an observation in the dataset.
-
Line Graphs: Ideal for displaying trends over time. It connects data points with lines to show changes.
-
Histograms: A representation of the distribution of numerical data. It shows the frequency of data points in specified ranges (bins).
-
Box Plots: Provide a summary of a dataset's central tendency and variability, highlighting the median, quartiles, and potential outliers.
Illustration of Statistical Graphics:

Information Visualization
Information visualization focuses on displaying complex data relationships in a way that can be understood at a glance. It aims to make the data visually appealing while maintaining clarity.
Examples:
-
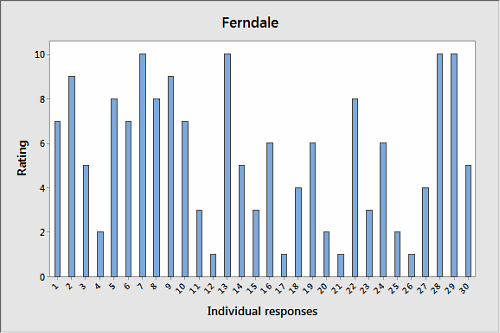
Bar Charts: Useful for comparing quantities across different categories.
-
Pie Charts: Show proportions and percentages between categories. However, they should be used sparingly as they can be misleading if not designed well.
-
Heatmaps: Visual representations of data where values are depicted by colors, helping identify patterns over a two-dimensional space.
Illustration of Information Visualization:

Geospatial Visualization
Geospatial visualization represents data with geographical information, often using maps to show patterns or distributions.
Examples:
-
Choropleth Maps: Used to visualize data variables over geographic regions by coloring regions based on their values.
-
Symbol Maps: Represent data points on a map using symbols, where the size of the symbol indicates the magnitude of the value.
-
Flow Maps: Show movement or flow of data from one location to another, useful for representing transportation routes, migration patterns, etc.
Illustration of Geospatial Visualization:
![]()
Popular Data Visualization Tools
-
Tableau: A powerful tool for creating interactive visualizations with a user-friendly interface.
-
Power BI: Microsoft's business analytics service that provides interactive visualizations and business intelligence capabilities.
-
D3.js: A JavaScript library for producing dynamic and interactive data visualizations in web browsers.
-
Matplotlib: A Python library used for creating static, animated, and interactive visualizations.
-
ggplot2: An R package for data visualization that implements the Grammar of Graphics.
Best Practices for Data Visualization
-
Know Your Audience: Tailor your visualizations to the knowledge level and preferences of your target audience.
-
Keep It Simple: Avoid clutter and unnecessary details. Focus on conveying the main message.
-
Use Appropriate Visuals: Choose the right type of visualization for the data you are presenting.
-
Ensure Clarity: Use clear labels, legends, and titles to make the visualization easy to understand.
-
Be Accurate: Represent data truthfully without exaggerating or distorting information.
Case Studies and Examples
In this section, we will explore real-world case studies and examples of effective data visualizations. These examples will illustrate how various organizations have used visualization techniques to gain insights and drive decision-making.
- Case Study 1: Analysis of COVID-19 Data
- Case Study 2: Customer Insights from E-commerce Platforms
- Case Study 3: Visualizing Climate Change Data
Data visualization is an essential skill in the data science toolkit. By mastering various visualization techniques, students can effectively communicate insights and enhance their analytical capabilities.